5 Week7—GEE
5.1 Summary
Google Earth Engine brings together satellite imagery data from past decades to the present, including topographic maps, climate change data and other geospatial data. These datasets are pre-processed and stored in Google’s cloud for easy access and analysis.
GEE mainly uses Javascript to programming. Different from the QGIS, GEE converts all data into the Mercator projection when displayed.
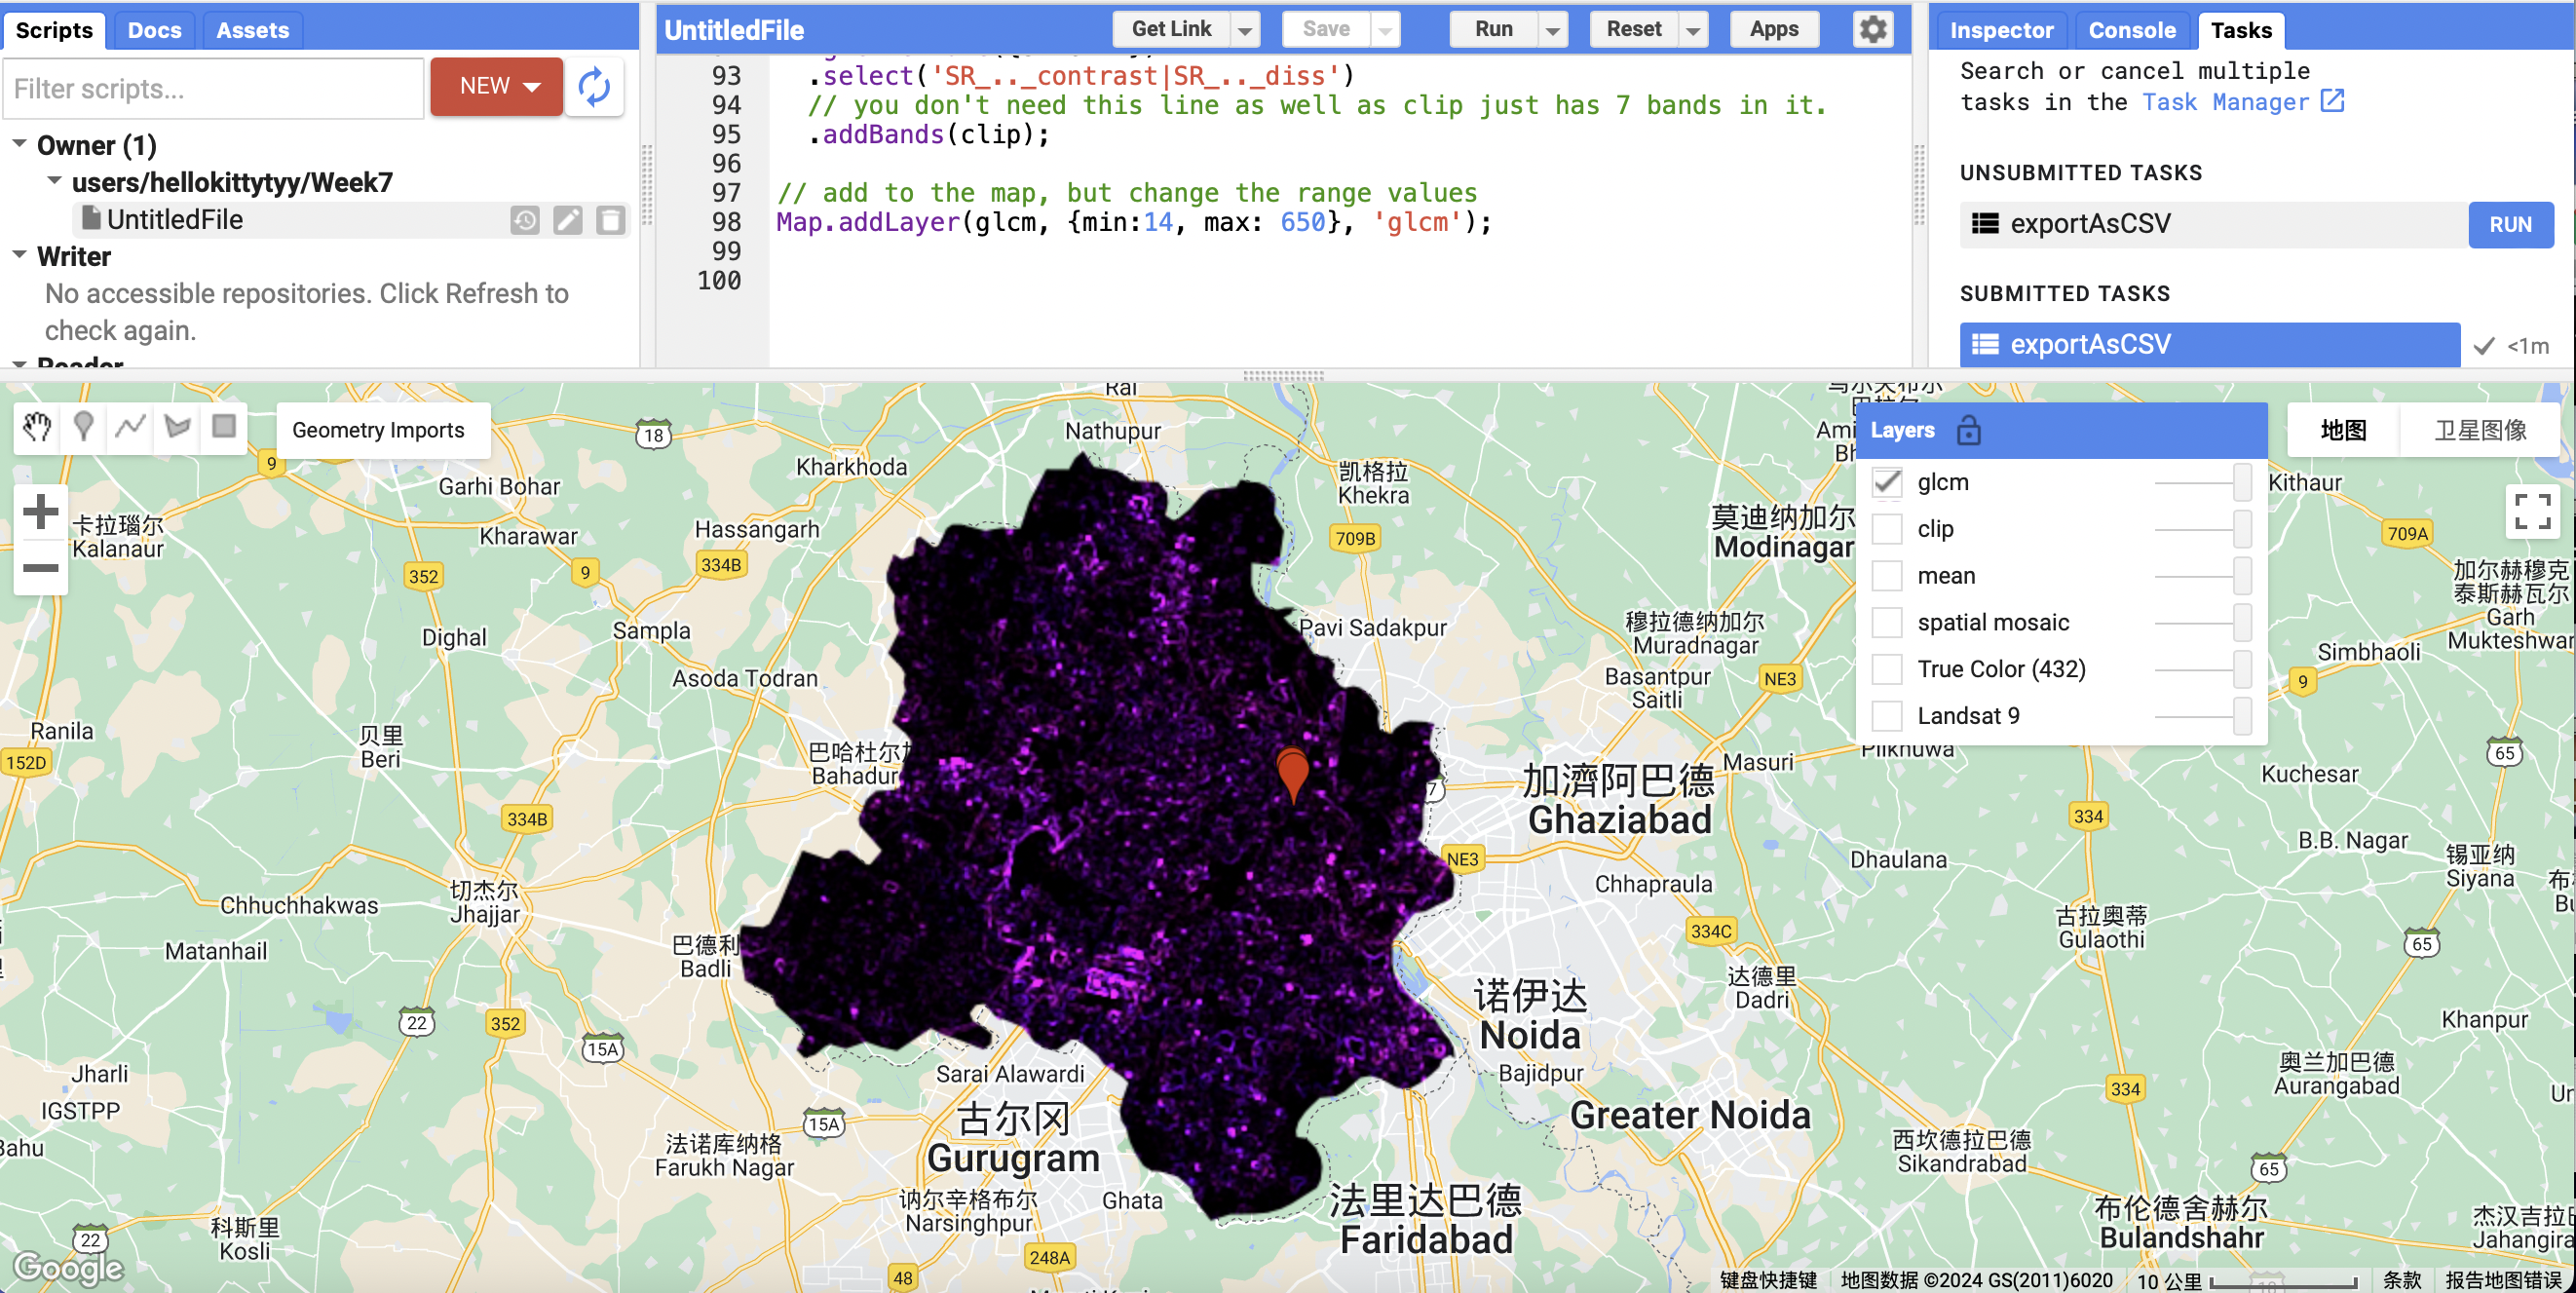
By choosing the layers, you can keep whatever you want. E.g.:
Another initial part is reducing images. This usually involves reducing the size, resolution, or amount of remotely sensed image data, which serves several purposes.
- Enhance processing speed.
- Saving storage space:fast transmission.
- Remove redundant information: key data are more prominent.
- Data integration: effective comparison and analysis.
- Improved analysis accuracy.
- Adaptation to algorithmic needs: Some image processing algorithms or machine learning models require input data with a fixed size or resolution.
Also linear regression has an important role in GEE to determine trends, variable correlation analysis and model prediction.
5.2 Application
Gorelick et al.(2017) illustrates GEE utilizes a catalog of satellite image data sets to study climate, vegetation, soil, water and many environmental factors and map and quantify changes, trends and trend differences.
Below is a map of Iran made with GEE by Jamali et al(2022).
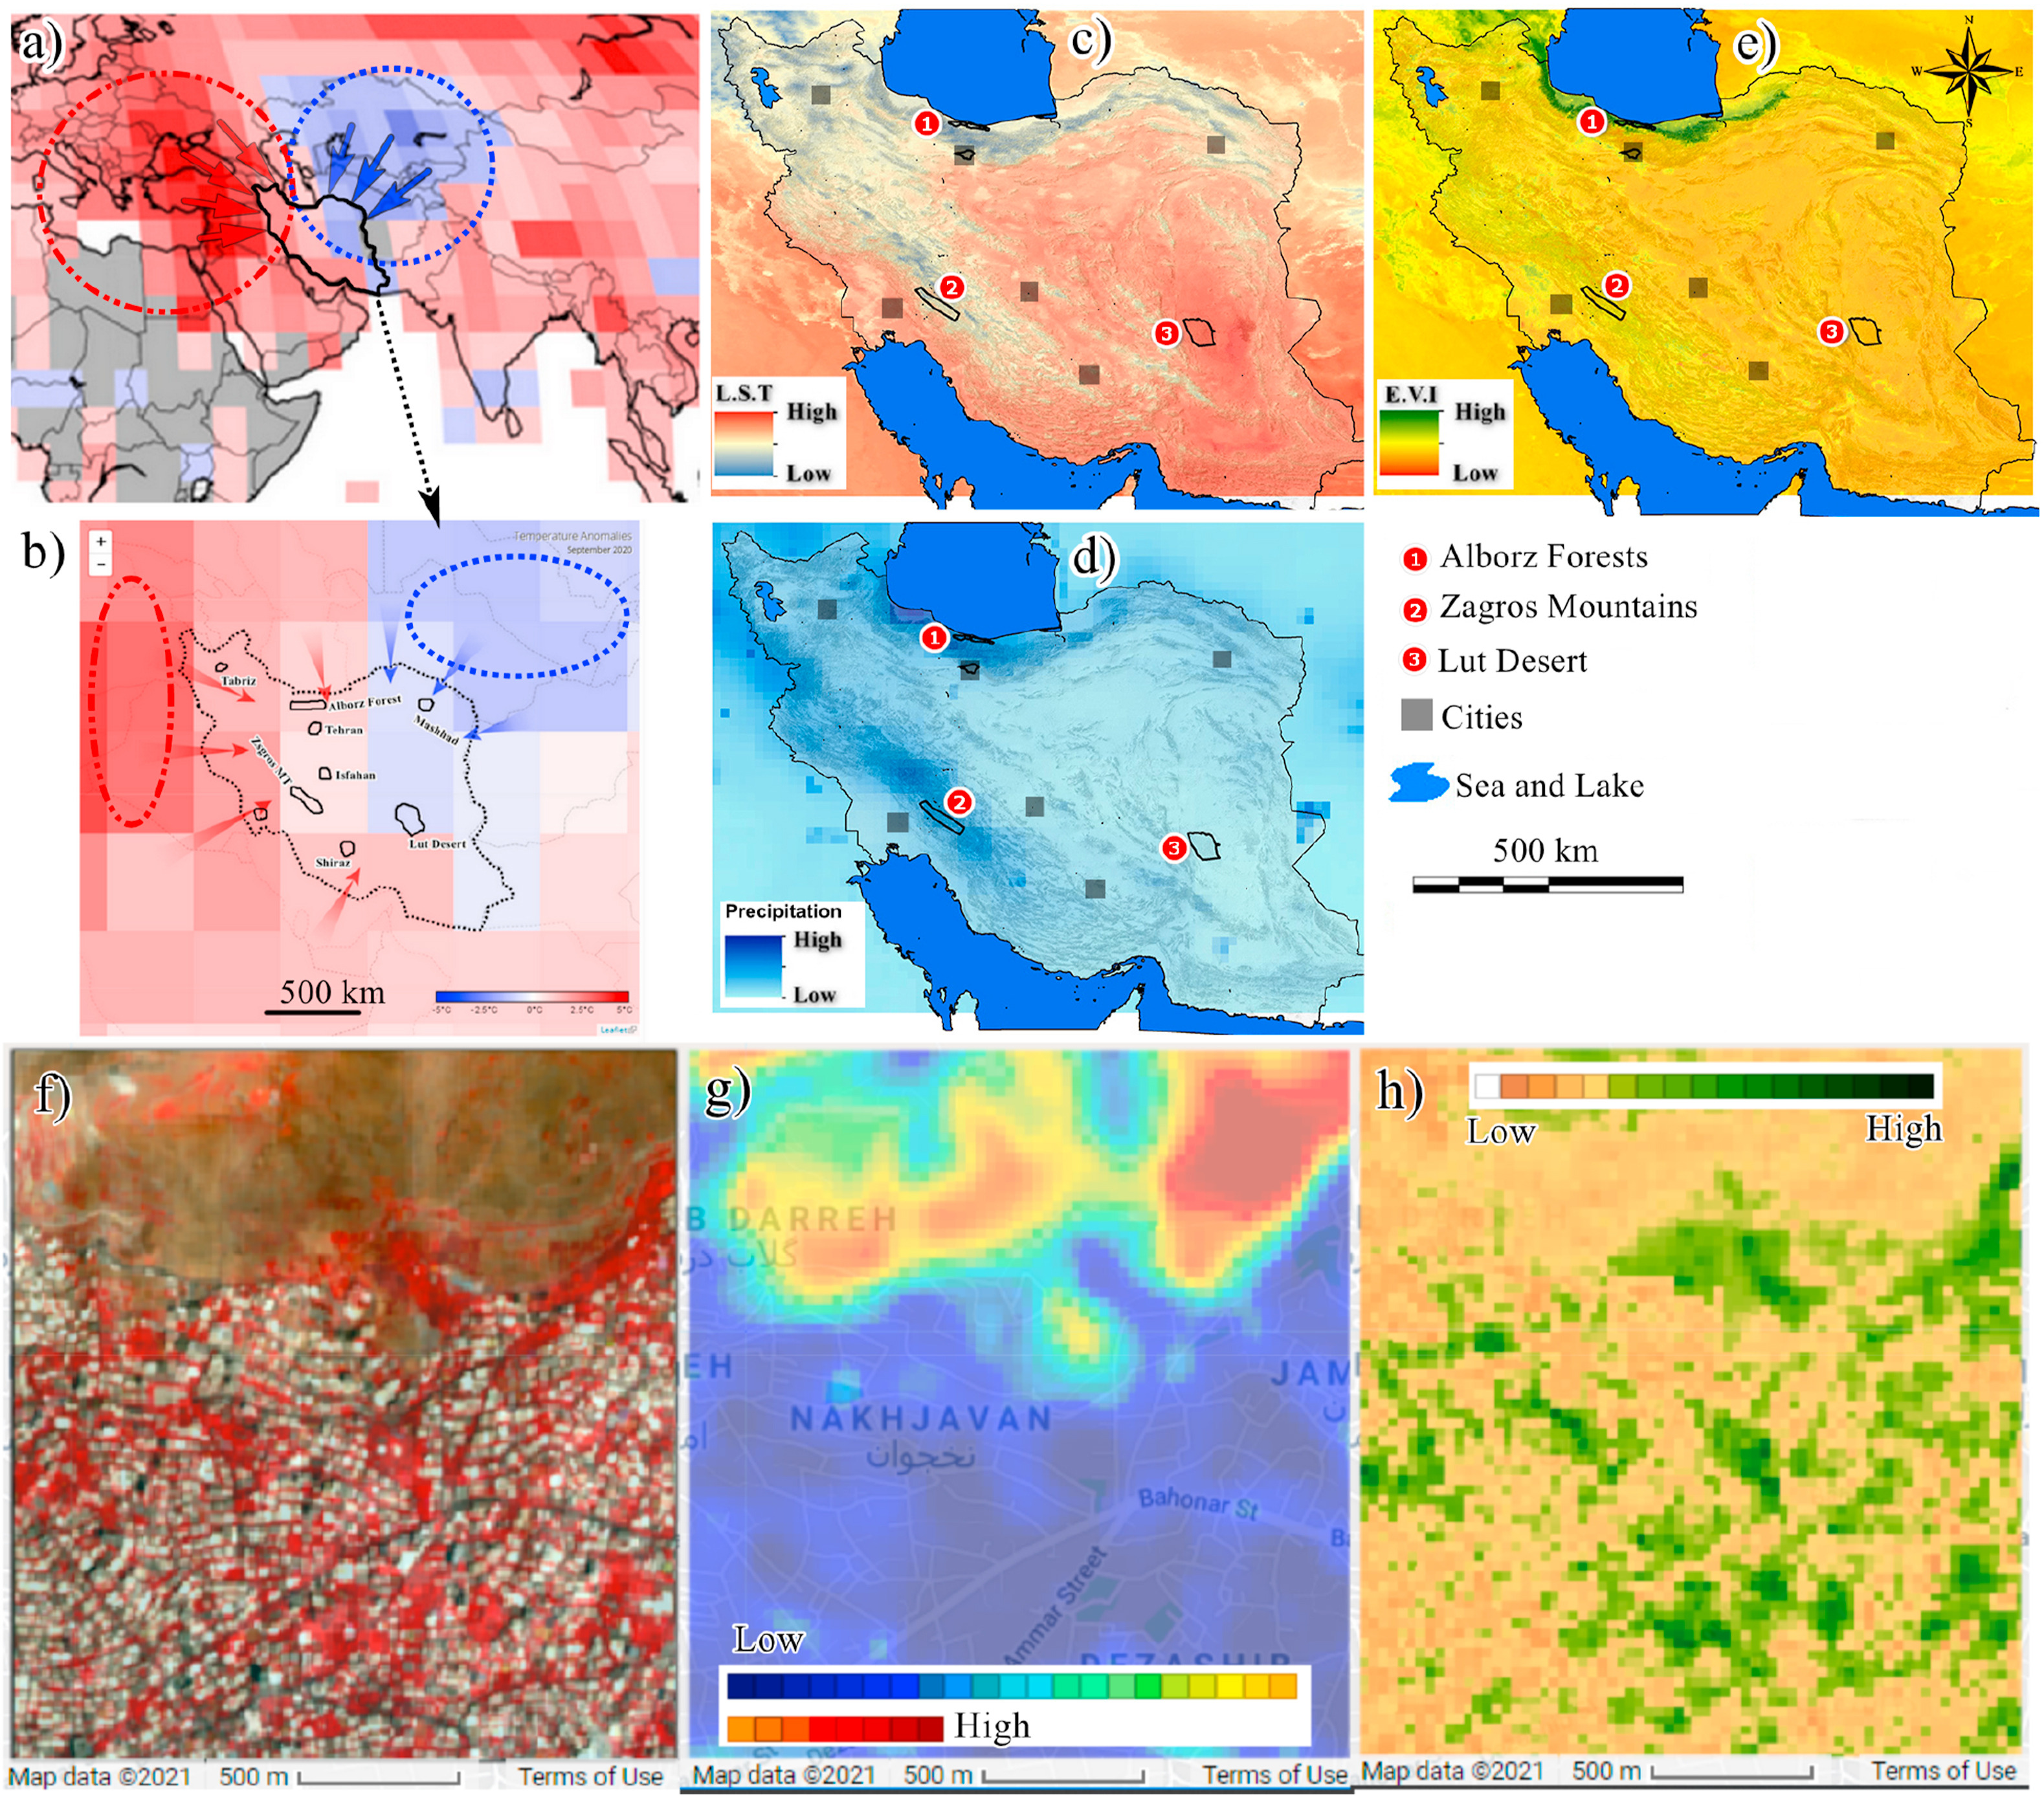
These images can be analyzed in this article to study climate change, vegetation dynamics, and land cover changes in the Iranian region to further study the relationship between surface temperature anomalies and the environment.
Although the operation and visual analysis of GEE has been much better compared to SNAP and QGIS, the problems still exist. One of the most noteworthy is that causality is not clear, e.g. correlations observed from remotely sensed data do not necessarily reflect causality. In the case of this illustration, surface temperature anomalies could be the result of environmental changes or the effect of other unobserved variables. This makes the picture complex and still requires subsequent data analysis and processing. And there is a lack of ground validation, with limited ground observations available in many cases. These may be attributed to the limitations of the model and algorithms, which need to be followed up with continuous improvement in order for us beginners to get a better handle on observing remote sensing images.
5.3 Reflection
GEE is friendly for remote sensing beginners, eliminates the complexity of looking up options, very intuitive to see areas such as Landsat8’s image, which it overlays on previous maps, and can zoom in and out and slide randomly, very interesting and good to watch. And just some simple Javascript writing, which is better for those of us who are not familiar with the code.
Google’s pioneering in maps is something I’ve always admired, I’ve enjoyed looking at live satellite maps on Google maps before, because he often captures some very interesting images, I’ve even seen my friends :) and the challenge of guessing regions on live satellite maps on the Youtube before was also very interesting, which is a great way for outsiders to get a better understanding of the geographic world, and a great way for insiders to get a better understanding of the world of geography. GEE in a way could work similarly for us, except that the term remote sensing can sound disinteresting, but it’s actually quite inspiring. I think I’ll spend more time with GEE and try to find out some of its hidden “tricks”.
5.4 Reference
Gorelick, N., Hancher, M., Dixon, M., Ilyushchenko, S., Thau, D. and Moore, R. (2017). Google Earth Engine: Planetary-scale geospatial analysis for everyone - ScienceDirect. Available at: https://www.sciencedirect.com/science/article/pii/S0034425717302900?via%3Dihub (Accessed: 25 February 2024).
Jamali, A. A., Ghorbani Kalkhajeh, R., Randhir, T. O. and He, S. (2022). ‘Modeling relationship between land surface temperature anomaly and environmental factors using GEE and Giovanni’. Journal of Environmental Management, 302, p. 113970. doi: 10.1016/j.jenvman.2021.113970.